


How DevOps and NetOps Can Better Understand Microservices Using Reveal(x)
Back to top

October 1, 2020
How DevOps and NetOps Can Better Understand Microservices Using Reveal(x)
ExtraHop Reveal(x) sees everything. It sees your application traffic, your users, your databases; it's all there. Sometimes, however, there are metrics and workflows that are unique to your business and your applications. This article covers several advanced topics to help maximize the visibility of your services environment.
We will cover:
- Open data streams
- Syslog logging
- Triggers
- Custom metrics
- Custom records
- Metric relationships
- Custom record drilldown
No matter how advanced any security tool is, there will always be value in smart security professionals who can figure out how to adapt solutions to their own unique environment. The goal of this article is to show you an approach you can adopt with your own services, complete with code samples to get you started.
The Scenario
Our scenario has a DevOps team supporting a platform of microservices. They're able to see their servers in Reveal(x) to spot errors and see the performance of URIs. What they'd really like to see is a service-centric view. How is my service performing? What does the consumption of my services look like? What or who is consuming my services? What data is being posted to the service?
For our example we will have two services, 'foo' and 'bar', with multiple versions deployed. Both services accept GET and POST requests.
We also have several workflows we need to support:
- We have a team of developers working on these services; they want to be able to see HTTP requests as they develop and debug services they're working on.
- We have an operations team that needs to plan capacity, maintain the availability, and manage the responsiveness of services.
- We have business units that need to monitor service level agreements.
Usage
To use the approach described here, a developer can add a debug-id header to requests they want to inspect; the trigger does the rest. The user will be able to search for and see transactions based on that ID.
Additionally, if you have many services making service-to-service calls, you may already have transaction or correlation IDs. The example uses a transaction-id header to tie multiple requests together so that it is possible to search by transaction ID and see a complete timeline of requests to multiple services
WARNING
Triggers are awesome and powerful, but there are finite resources available to process triggers. It is possible to remove the gate, debug-id, and enable this trigger on every HTTP request, but be aware of the load these triggers add and the additional storage used by records.
Monitor trigger load, cycles, and drops in the System Health dashboard to ensure the system is functioning optimally.
Open Data Streams & Syslog
We're going to be writing triggers and creating custom metrics. Part of any coding exercise is logging and debugging. Reveal(x) has built in debugging options but we're going to be creating custom records, and large JSON objects. We want to log these so we can verify everything is correct. Wouldn't it be nice if we could send the Reveal(x) debug output to our syslog server (or Splunk) where we have all of our other logging? We can.
Open Data Streams (ODS) is explained in detail here. ODS allows Reveal(x) to send data to various other systems. One of several supported methods, and the easiest to set up, is syslog.
To setup a syslog ODS target:
- Navigate to Administration
- Select Open Data Streams under System Configuration
- Click "Add Target"
- Enter the details for your syslog server
- Test
- Save
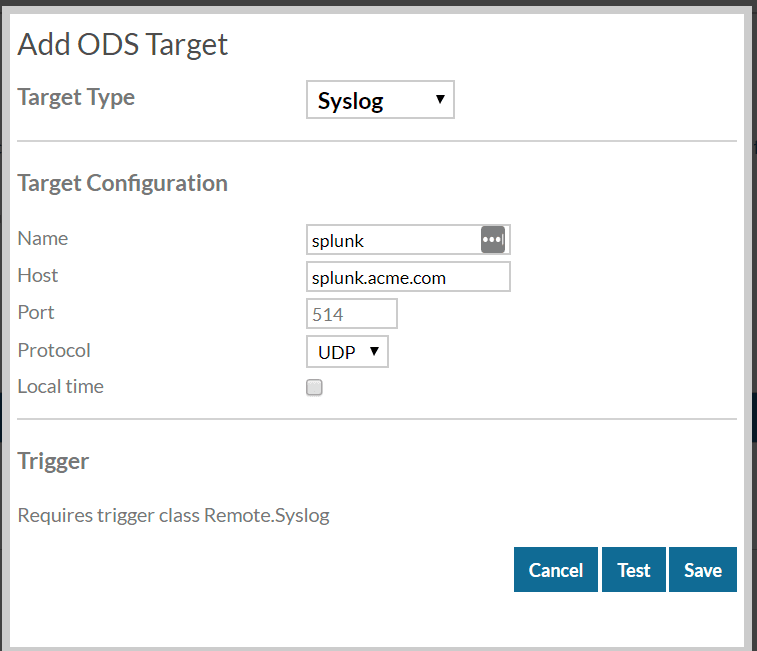
When we reference this ODS target in our trigger we'll use its name, which is "splunk" in this example.
In our trigger we'll add a function to log output to syslog:
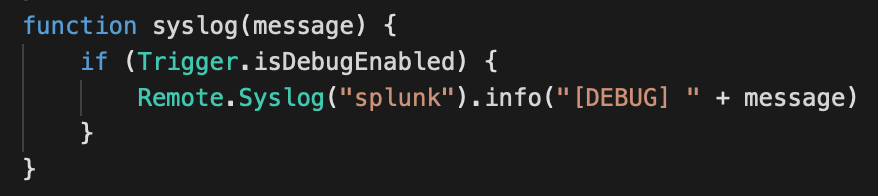
To use this function, simply use syslog("message") instead of debug("message"). Enable or disable debug in the trigger options as usual.
The Trigger
The trigger is where the magic happens. We're going to look at two events, HTTP_REQUEST and HTTP_RESPONSE. Because this trigger is going to potentially look at every HTTP request, we want to be selective about the ones we apply the advanced analysis to. To achieve that, we're going to ask our developers to add an HTTP header in the request called debug-id.
When the trigger sees a debug-id it will process the request. The id can be anything, but including a name or user id will help the developers tell their traffic from others'.
Most of the work will happen in the HTTP_RESPONSE event, but we need some information that is only available in the request. To do this we capture it and store it in Flow.store to be retrieved in the HTTP_RESPONSE event.
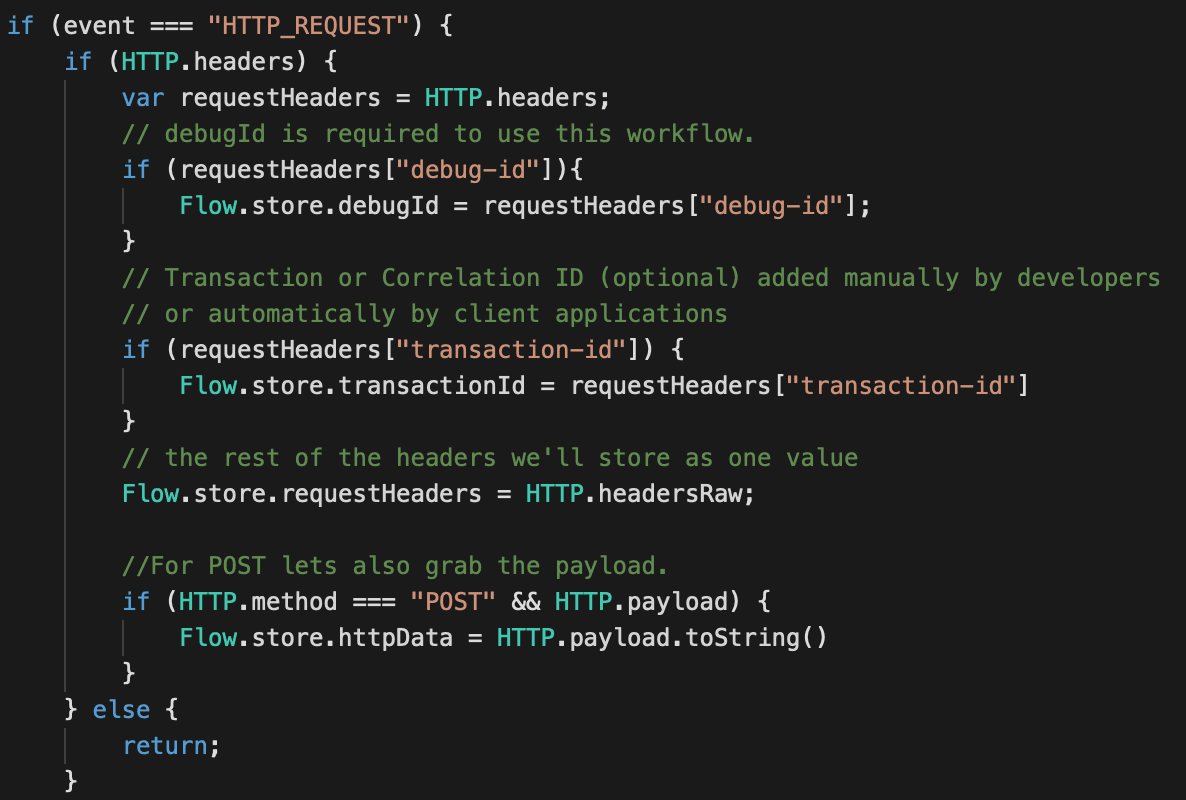
In the HTTP_RESPONSE we will retrieve the values from Flow.store and capture additional data from the response. Here is where you will need to customize the trigger for your applications' URI scheme. In our example, the service name is the first component at the root of the path; http://web.acme.com/foo/1.
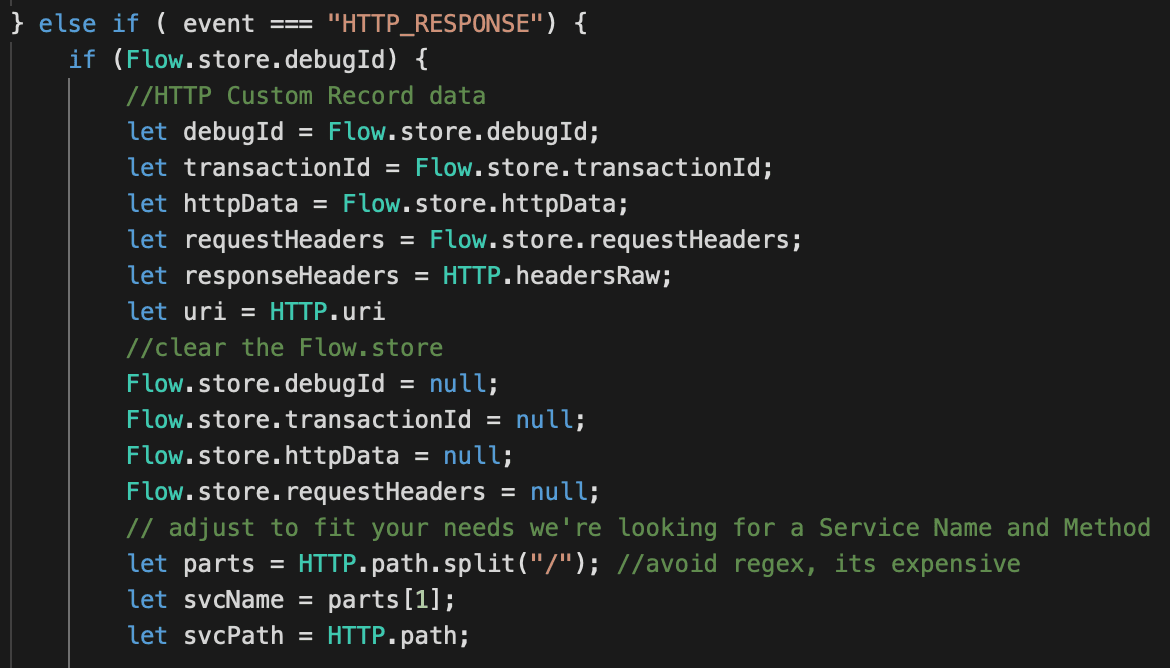
Next we'll record the custom metrics.
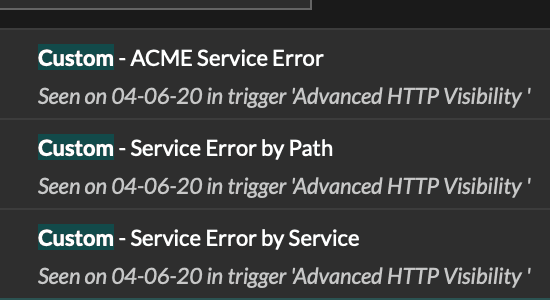
ACME Services is a generic name for our example, this could be any name that defines this logical grouping of services.
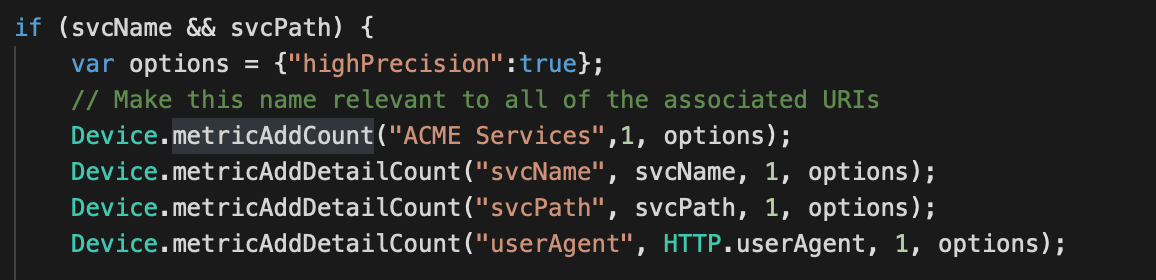
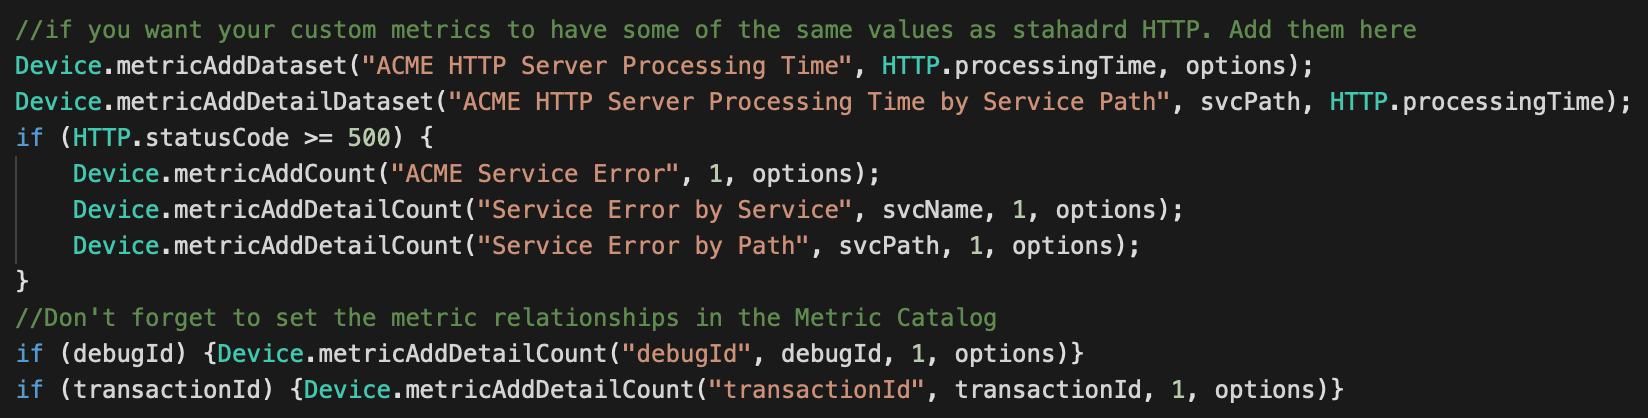
Later we'll set the metric relationships in the Metric Catalog. Every service request gets added to our base metric "ACME Services" and then scvName, svcPath and userAgent are detail metrics. Detail metrics relate to the base metric but provide the ability to drill down by another value. We'll repeat this pattern for "ACME Services Error" below.
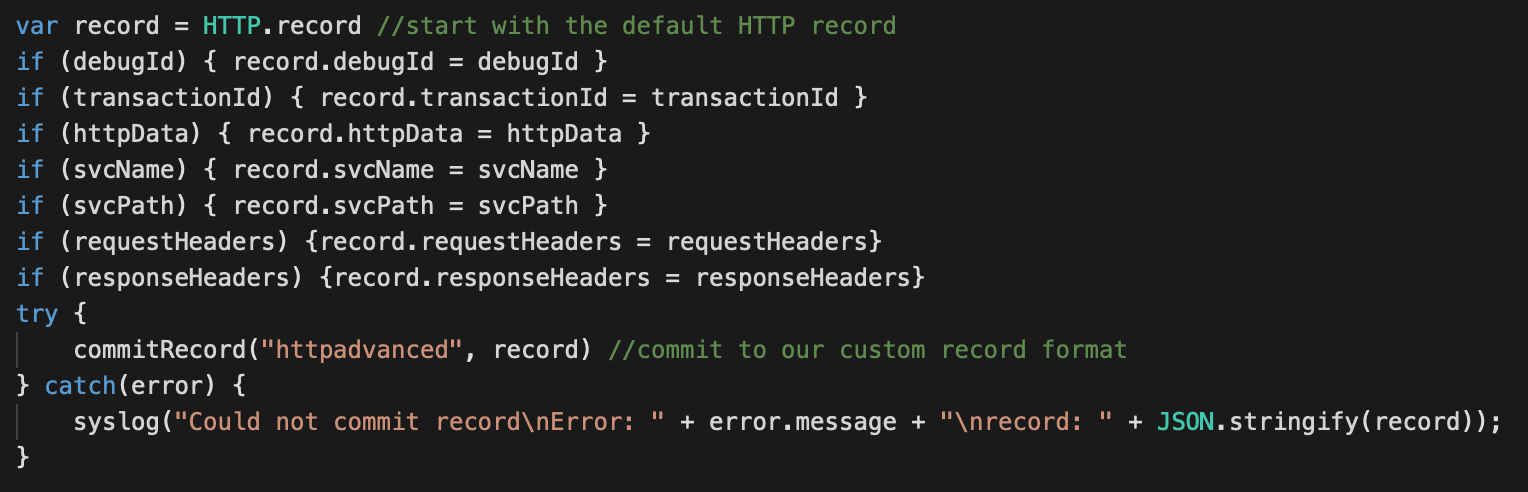
Now we'll add the code for the custom record. This code requires that we define a custom record format, so we'll do that after the trigger.
Creating a custom record is straightforward. We assign all the values from the default HTTP record then add our custom values if they exist. Each of these custom record fields will be defined in our record format.
That's it for the trigger, we now have an application with custom metrics as well as a custom record.
Next we need to create the record format.
Custom Record Format
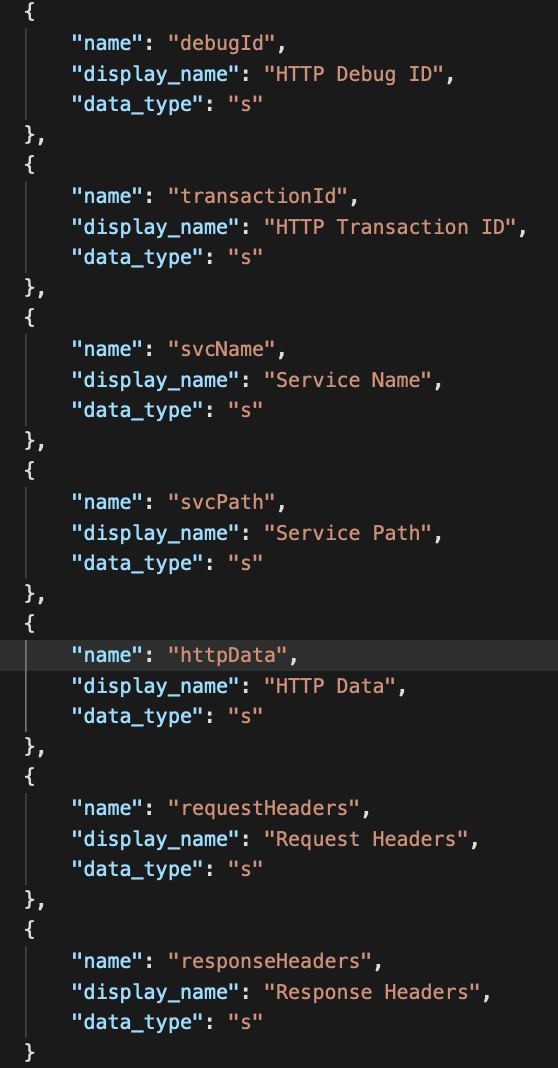
In order to store and search our custom records, we need to define the schema. For our purposes we're going to copy the HTTP record and add our new fields.
- Head over to the System Settings (gear menu) and select Record Formats
- Select the entry for HTTP
- Copy the JSON
- Click "Create" to make a new Record format.
- Paste the JSON in the large text field.
- Enter "HTTP Advanced" for the Display Name
- Enter "httpadvanced" for Record Type
- At the end of the JSON append the following custom fields then click "Done"
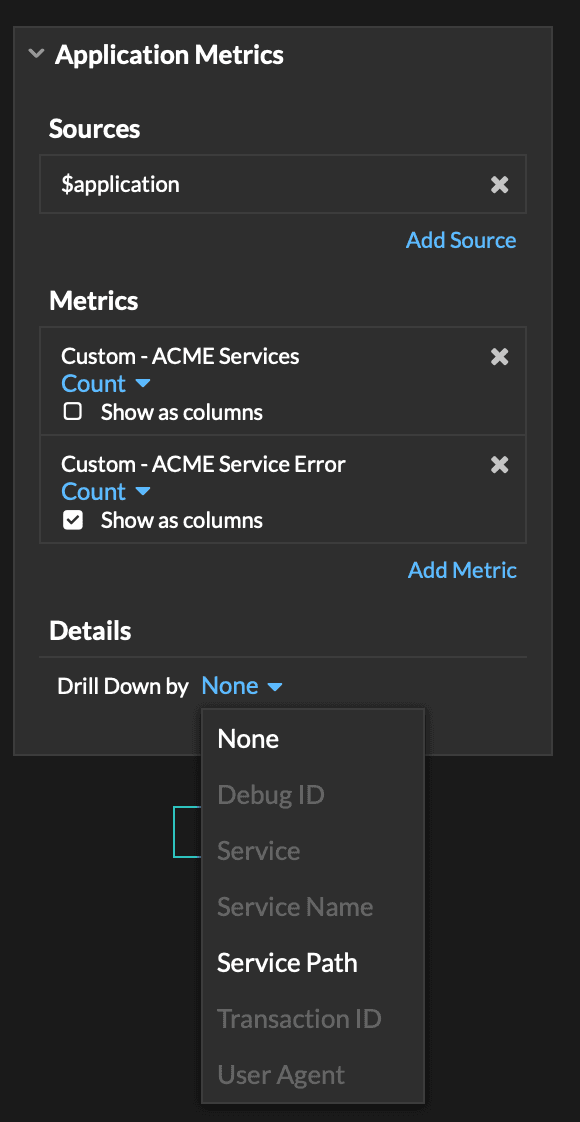
Metric Relationships
There are two general types of metrics: base metrics and detail metrics. The base metric is what you select in your dialogue when making a dashboard. The detail metric is what you select to "Drill down by . . . "
To create this relationship we need to use the Metric Catalog:
- Go to System Settings (gear menu)
- Select Metric Catalog
Let's use the error metrics we created
ACME Service Error is our base metric. "By Path" and "by Service" are the details.
- Select Service Error by Path
- Set the Units. This is a count, so choose integer
- Set Key Label to by Path
- Key Label is the is the value seen when choosing "Drill Down by . . . "
- For Base Metric, select Custom - ACME Services
- For Record Type, select HTTP Advanced
- Record Type allows you to jump to the related records using our custom record type
- For Additional Filters choose Service Path = $KEY
- The filter will pre-populate the records query with the value selected in the drill down
- Repeat for the other custom metrics
- ACME Services (base)
- Service Name (detail)
- Service Path (detail)
- Debug ID (detail)
- Transaction ID (detail)
- ACME HTTP Server Processing Time (base)
- ACME HTTP Server Processing Time by Service Path (detail)
- Units are milliseconds
- ACME Services (base)
Dashboarding
When the relationships are set, you should be able to add metrics to charts and see your custom drill downs.
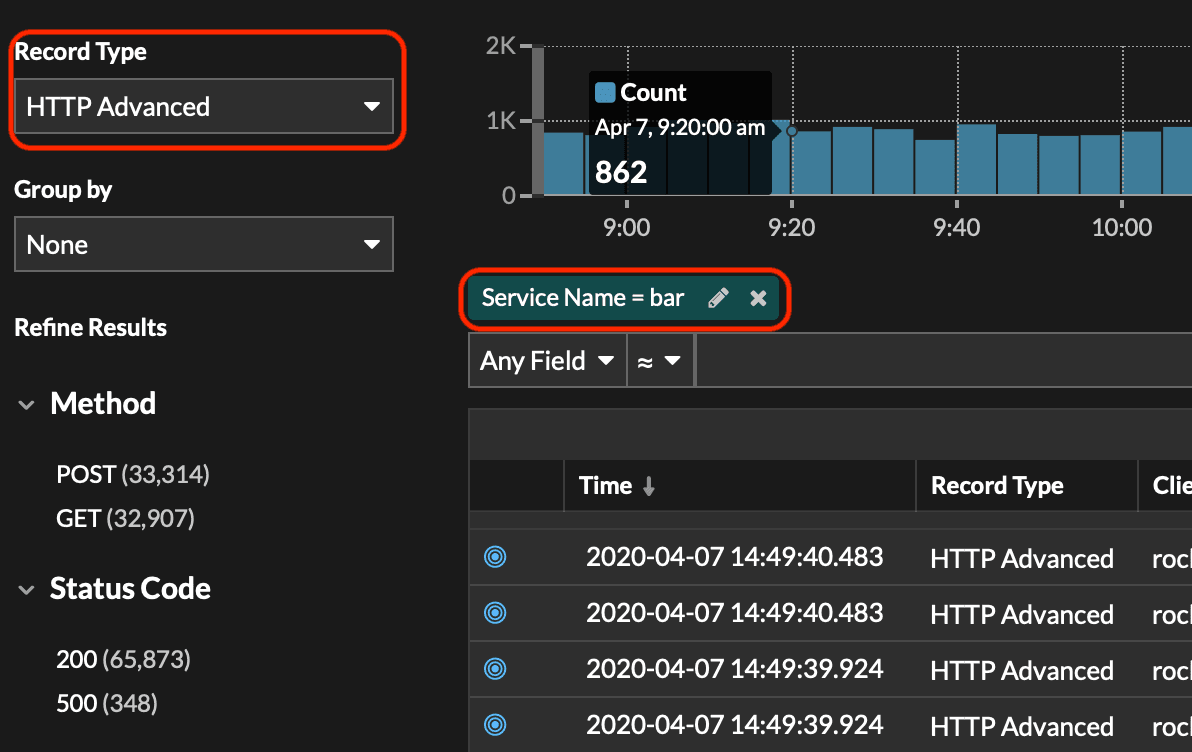
Searching Records
Once the trigger is running and creating records, you should be able to drill down from the dashboard by selecting a value, right clicking, and choosing records.
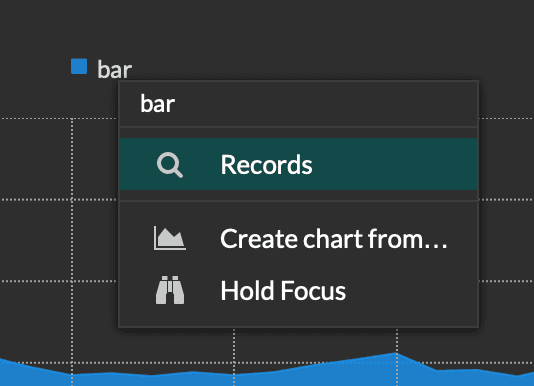
You should see the Record Type and Value pre-populated in the query.
Conclusion
We now have custom metrics providing additional visibility at the service level, sorted by developer and transaction ID. We're capturing request headers, response header, POST data and the query string.
Our developers can debug their workflows on demand without needing any intervention from operations and we can provide detailed dashboards about service consumption.
For more detailed guides and how-to's, check out the ExtraHop Documentation hub.
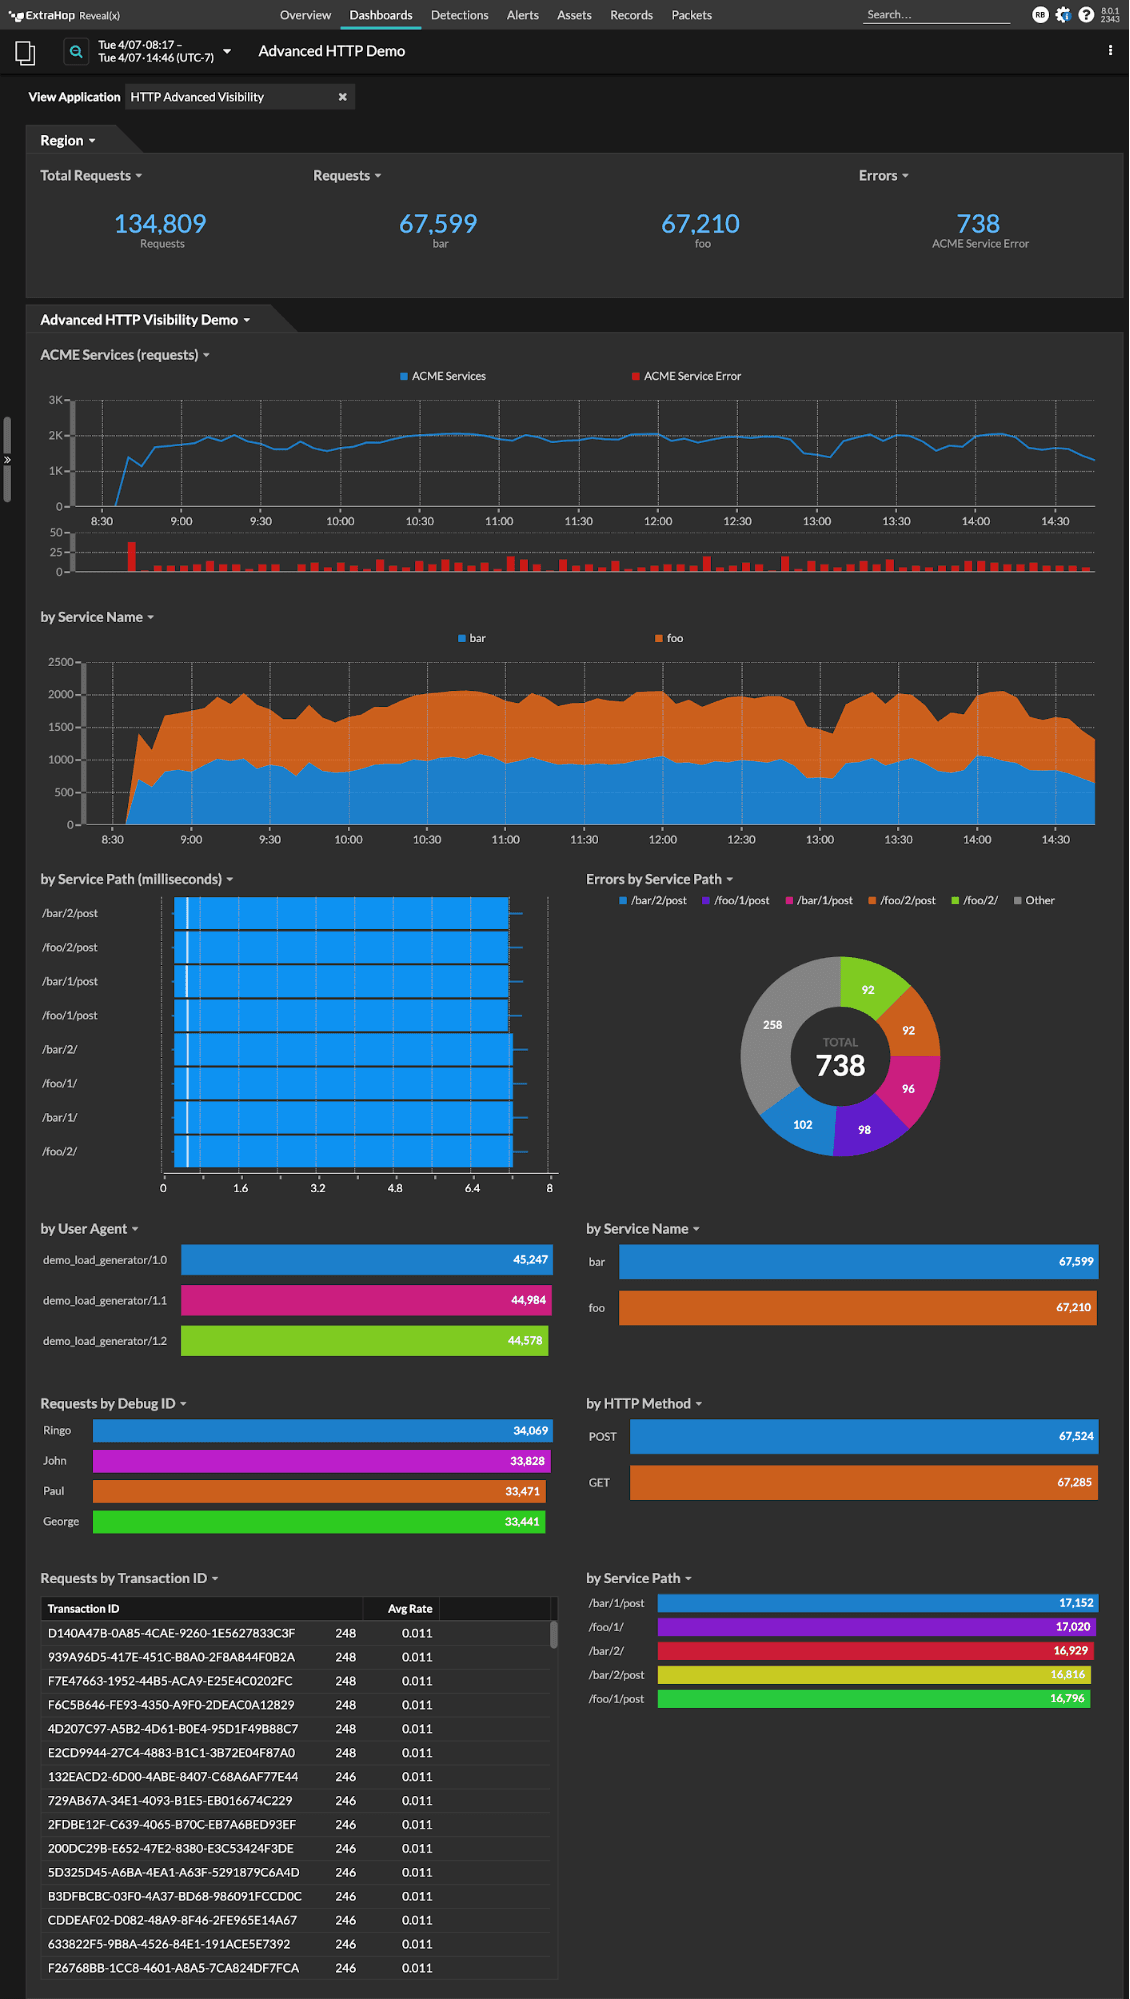
Here's what your finished dashboard will look like:
Discover more

