


Turla Trojan Tactics Trounced
Back to top

January 7, 2015
Turla Trojan Tactics Trounced
About a month or so back, just before the holiday stretch set in for many of us here in North America, Ars Technica put out an article depicting a new vector for Turla, namely a "Powerful, highly stealthy Linux trojan" that "may have infected victims for years." I don't know about you, but to me that sounds … suboptimal. Linux is seldom the point of entry for such attacks. Many people, myself included, take solace in this fact. That also means that when we hear about this sort of thing, we take notice.
Since security is is a big concern 'round these parts, I took a look on a more professional level. My goal was to check what could be done using some crafty ExtraHopian (Yep, that's totally a word now. You're welcome.) tech to help uncover these allegedly "stealthy" trojans. Stealthy may sound scary to some, but if it's transmitting over the wire we're gonna see it one way or another.
Turns out it was, in fact, transmitting over the wire. You kind of have to be if you want to do anything once you have access to all those trojan-infected systems. Like most trojan systems, any devices infected with the Linux strain of Turla are calling back to command and control channels. Because they're calling back to a known host/IP, ExtraHop can identify any device sending traffic to those destinations as infected. "Great!" I thought. "Let's track any traffic to that IP!"
But wait. What about when they (the craft hackery types that design such things) decide to update their code, no longer kindly leaving the IP address of their command channel well documented in this handy Ars Technica article? Well, if we can't be sure where they're going to send data once infected, we can at least be a little bit more sure of what they are going to send. In this case, as the article states, the strings in question being sent back to the command channels are "TREX_PID=%u" and "Remote VS is empty !". Those are the strings that compromised systems were shipping off to the not-so-awesome IP listed above. We know, with a reasonable amount of certainty, that if a system is firing off payloads containing those strings, we can list them as compromised as well as those sending to the known bad IP.
This means that we want to answer three basic questions:
- Which devices are connecting to a known bad host?
- Which devices are sending a known bad string to any host?
- Which strings are being sent (and from where to where)?
These triggers are wickedly powerful, and downright cool tech to geek out with. I was able to throw together a few lines of code to not only decide if bad, Turla-esque things were happening, but also to make it crazy simple to track exactly what those bad things were. Talking about it is great and all, but I prefer nuts and bolts, so let's see how this looks in action.
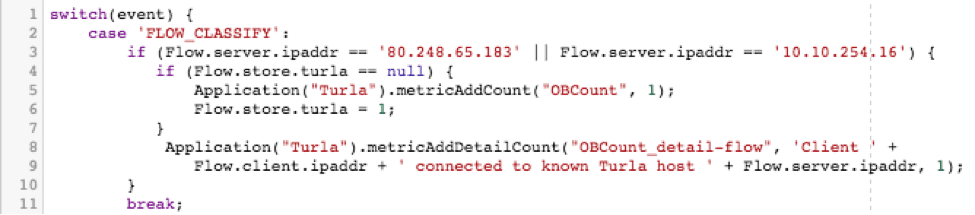
Remember our first goal from above? "Which devices are connecting to a known bad host?" To achieve this, we're going to use the FLOW_CLASSIFY event. This event is raised any time a flow we're monitoring is classified into a certain type. We're using this event because it's a pretty low impact way to do things like check for a given destination. Since the classification only ever happens once in a given flow, and happens pretty early on, we're not going to be executing this code repeatedly and churning valuable cycles unnecessarily.
Once we find a connection to the known bad IP, we want to increment a metric on the ExtraHop. This is done with the metricAddCount command signifying that yes, this flow does indeed represent a bad system. We only want to do this once per flow, however, or we'll end up double counting, so we throw a little extra logic around it, making use of the Flow store, which I'll likely get into discussing another time. (Note that two IPs are used in this example, one is my dev box used to reproduce and test this example, the other is the actual bad IP.)
Once we can see that some badness is in fact happening, thanks to our top-level metric, we then want to dig deeper and add a more detailed metric that gives us more detailed data, such as which client was connecting to which known bad host. Now we can more precisely track which hosts we need to investigate within our network. We can do so by creating a detailed metric with the metricAddDetailCount command. Here's what these two things look like when combined:
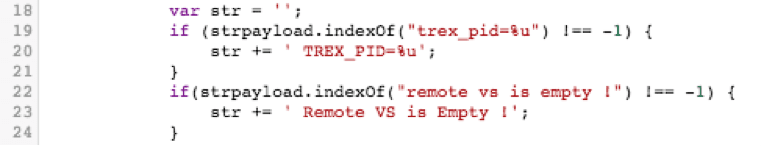
The next two questions are: "Which devices are sending a known bad string to any host?" and "Which strings are being sent?". As it turns out, these two issues get solved pretty much the same way. Since we're going to have to search for both of those strings within the payload to see if either is being sent, and then increment a counter to say "Yes, we saw a bad string, count it…" it's pretty trivial to determine from which host the request was sent, and to break things out by which strings we're seeing. For this we'll use the TCP_PAYLOAD event because we'll need to dig into the … well … payload.
First we unpack said payload, in this case as plaintext, then turn it into a string, and force it to all lowercase. At this point we're able to easily pick through it, looking for at least one occurrence of either of our strings proving that the system in question is misbehaving. If we do happen to find one of our known bad strings, we know we've got an infected system on our hands. As before, we want to increment our top-level level metric effectively saying, "Yep, found something bad," so long as that counter hasn't been ticked up for this flow already. But this time it's even more important that we track more detailed information in our metric.
Here is where we're able to collect data about which strings are being sent to and from which hosts, etc. As before, we do this using the metricAddDetailCount command. Breaking things down into functional sections:
If the payload isn't empty, turn it into a plain text, lowercase string for easy matching.

Once that's done, if we see either of our bad strings, capture which one was seen. (Remember, we're matching in all lowercase thanks to the above toLowerCase(); command)
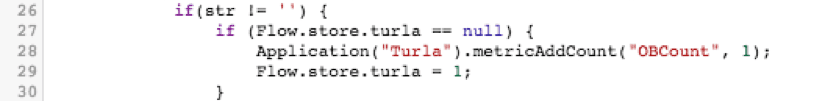
If we saw one of our known bad strings and the top-level metric hasn't been incremented already this flow, go ahead and increment it, and set the Flow.store.turla flag to 1. (This will prevent the metric from double counting a malicious flow.)
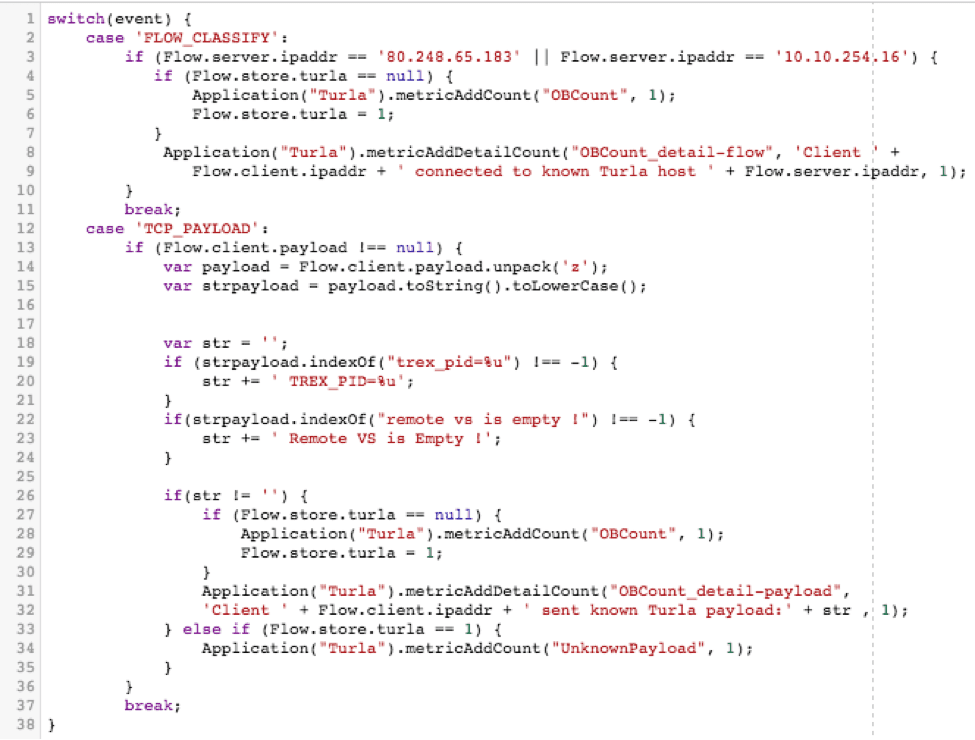
Also, add some details around which string was seen, and which client sent it. This is done by way of the metricAddDetailCount command.

Lastly, if we saw a bad connection to an IP, but it didn't match one of our two strings, list it as an unknown payload.

If we throw all of that together with the FLOW_CLASSIFY portion above, we get to see the entire solution:
So now you've got some sweet code that tracks all sorts of data. What the heck do you do with it? Well, that's part of the beauty of the ExtraHop model. Those metrics we were tracking in our code with metricAddCount and metricAddDetailcount? Those are easily and immediately available from within a dashboard. It took me about 5 minutes of clicking around in the GUI (and I had never driven one of these things before, really) to figure out how I wanted things to be displayed, and suddenly the traffic my trigger was collecting was easy to read and oh so pretty. In fact, it looked exactly like this:
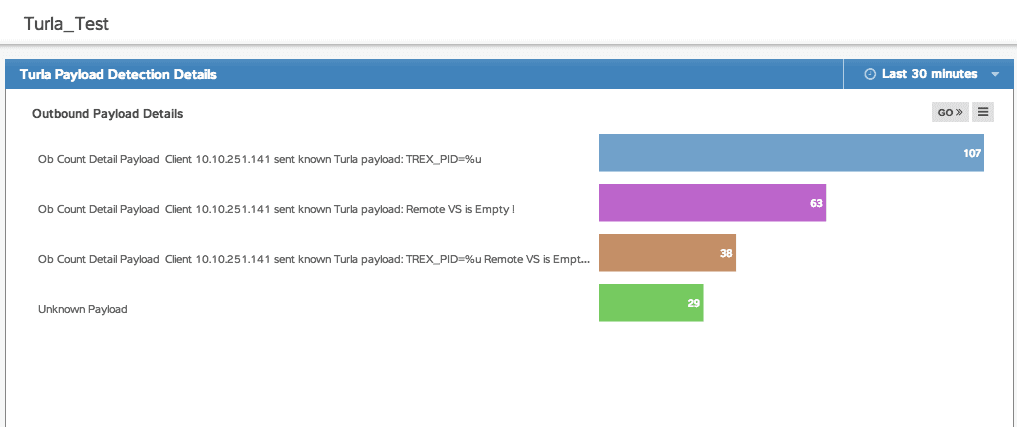
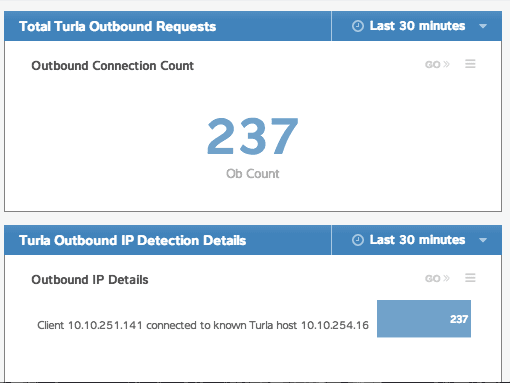
It's pretty basic as far as dashboards go, but it gets the job done, and it looks approximately 182197% sexier than raw code or numbers in a database if you're trying to explain to someone why those systems need to be taken offline for a while for maintenance.
So there you have it. We found a unique problem, a potential security risk at that, and we sniffed it out handily with our trusty ExtraHop platform, and the awesome power that is triggers. They said it was "stealthy," but that's no match for the super-sleuthing prowess of ExtraHop. That's just getting my feet wet a bit and is definitely on the simple side of things, but with triggers the sky really is the limit.
To learn more about triggers, you should check out what people are up to on the forums.
Want to learn to detect and prevent data breaches in real time? See how in our free, interactive online demo.
Discover more


Solutions Engineering Manager
Starting first in Unix (BSDi/FreeBSD) technical support for a shared web hosting company and working up through sys-admin and eventually to software engineer, Colin has steeped in applications and automation for over 15 years. With a background in programming and applications, he somehow ended up working in the networking world, and never looked back. Colin spent the last 10 years at F5, working on their DevCentral user community. He's excited to be a part of the ExtraHop team and looks forward to helping the ExtraHop community grow and flourish by helping IT pros better applications everywhere by wielding the power of wire data. Twitter: colin_walker.