 Blog
Blog
TCP: Where the Network Meets the Application, Part 1
Justin Baker
August 9, 2012
This post is written by Eric Thomas, Principal Solutions Architect at ExtraHop Networks.

Risks of Agent-Based Monitoring Tools
The cost of that detail, though, is in the CPU cycles required to gather the data and—perhaps more importantly—in the introduction of a new and potentially unstable layer to your application delivery stack. Bugs or misconfigurations in the instrumentation can cause unpredictable behavior, such as abnormally high CPU loads or even application crashes. You'll know you've fallen into this particular pit when you're spending more time managing your monitoring tool than managing your application—or when your monitoring tool takes down your production infrastructure during peak load.
Passive end-user experience (EUE) monitors such as Tealeaf from IBM and Coradiant from BMC Software offer a no-impact approach to HTTP monitoring. While we give them due credit for leaving production systems undisturbed, they fall short in the level of detail offered and in many cases raise more questions than they answer. Was that bad request the result of an under-provisioned web stack, or was the database to blame? What about storage, or the network, or the myriad other dependencies in the chain? Knowing that a particular transaction is slow is of limited utility if you can't explain why.
A Thought Experiment: Imagine the Ideal Application Monitoring Solution
everyevery
What about a dedicated application management layer transparent to both applications and the networks that deliver them? What if we could wrap every transaction in a seamless framework that provides insight into the entire application delivery stack with no impact on the application?

While we're at it, what if this management layer actually improved application delivery? What if it automatically adjusted to congested networks, for example, or compensated for underpowered servers? What if we could guarantee delivery of every one of our transactions?
And here's the best part: this magical framework would incur no overhead, because your applications are already using it in production. No, it's not ExtraHop's latest addition to the product line. It's the Transmission Control Protocol, or TCP.
A Healthy Obsession With Transmission Control Protocol (TCP)
higher-order application protocolsHTTPthe SQL familymemcache
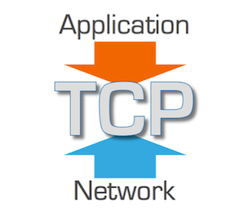
TCP is where the application meets the network, and the interaction between the two allows us to answer two fundamental questions about application performance:
- How well is the network delivering the application?
- How well is the application using the network?
Retransmission Timeouts (RTOs)
Read Part 2 of this series, TCP: Where the Network Meets the Application.
Discover more